Mancia's Maps
Followers
Blog Archive
▼
2010
(51)
▼
July
(50)
Multivariate Choropleth Map
Classed Choropleth Maps
Unclassed Choropleth Maps
Parallel Coordinate Plot
Stem and Leaf Plot
Box Plot
Triangular Plot
Cartographic Animations
Population Pyramids
Population Profile
Histogram
Wind Rose
Climographs
Correlation Matrix
Star Plot
Scatter Plot
Index Value Plot
Accumulative Line Graph or Lorenz Curve
Bilateral Graph
Pie Chart
Social Network Map
LIDAR
Doppler Radar
Black and White Aerial Photo
Infrared Aerial Photo
Statistical Maps
Cartograms
Proportional Circle Map
Propaganda Map
Mental Map
Flow Maps
Digital Ortho Quarter Quads Map
Digital Elevation Model Map
Choropleth Map
Dot Distribution Map
Hypsometric Map
Public Land Survey System Map
Cadastral Map
Thematic Map
Isoline Map
Isobars
Isotachs
Isohyets
Isopach
Isotherm
Isopleths
Digital Raster Graphic
Digital Line Graphs
Topographic Map
Planimetric Map
►
May
(1)
About Me
Jeff
View my complete profile
Thursday, July 29, 2010
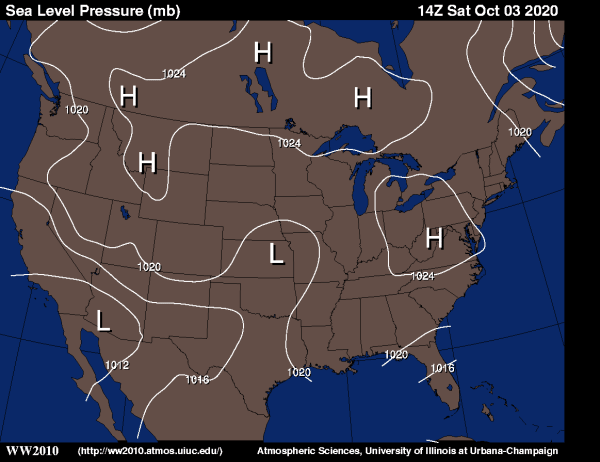
Isobars
Source:
http://ww2010.atmos.uiuc.edu/%28Gh%29/wx/cwp/prods/current/sfcslp/sfcslp_N.gif
Isobars maps are a type of Isoline line map in which the continuous lines joiningareas of the same or similar values, represent atmospheric pressure. This map was produced for Friday July 30th and shows isobars only for the United States.
No comments:
Post a Comment
Newer Post
Older Post
Home
Subscribe to:
Post Comments (Atom)

No comments:
Post a Comment