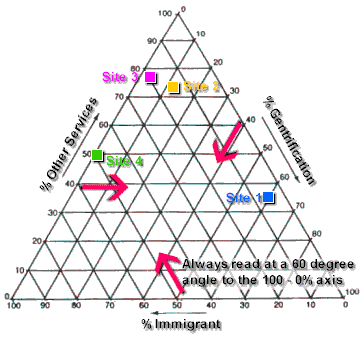
This type of geovisualization is used to compare three variable as positions on an equilateral triangle. In this example the variables are immigrant, other service and gentrification. The intersection of lines on these graphs indicates the interaction of the variables.
No comments:
Post a Comment